
bewitch
A charming system monitor for Linux
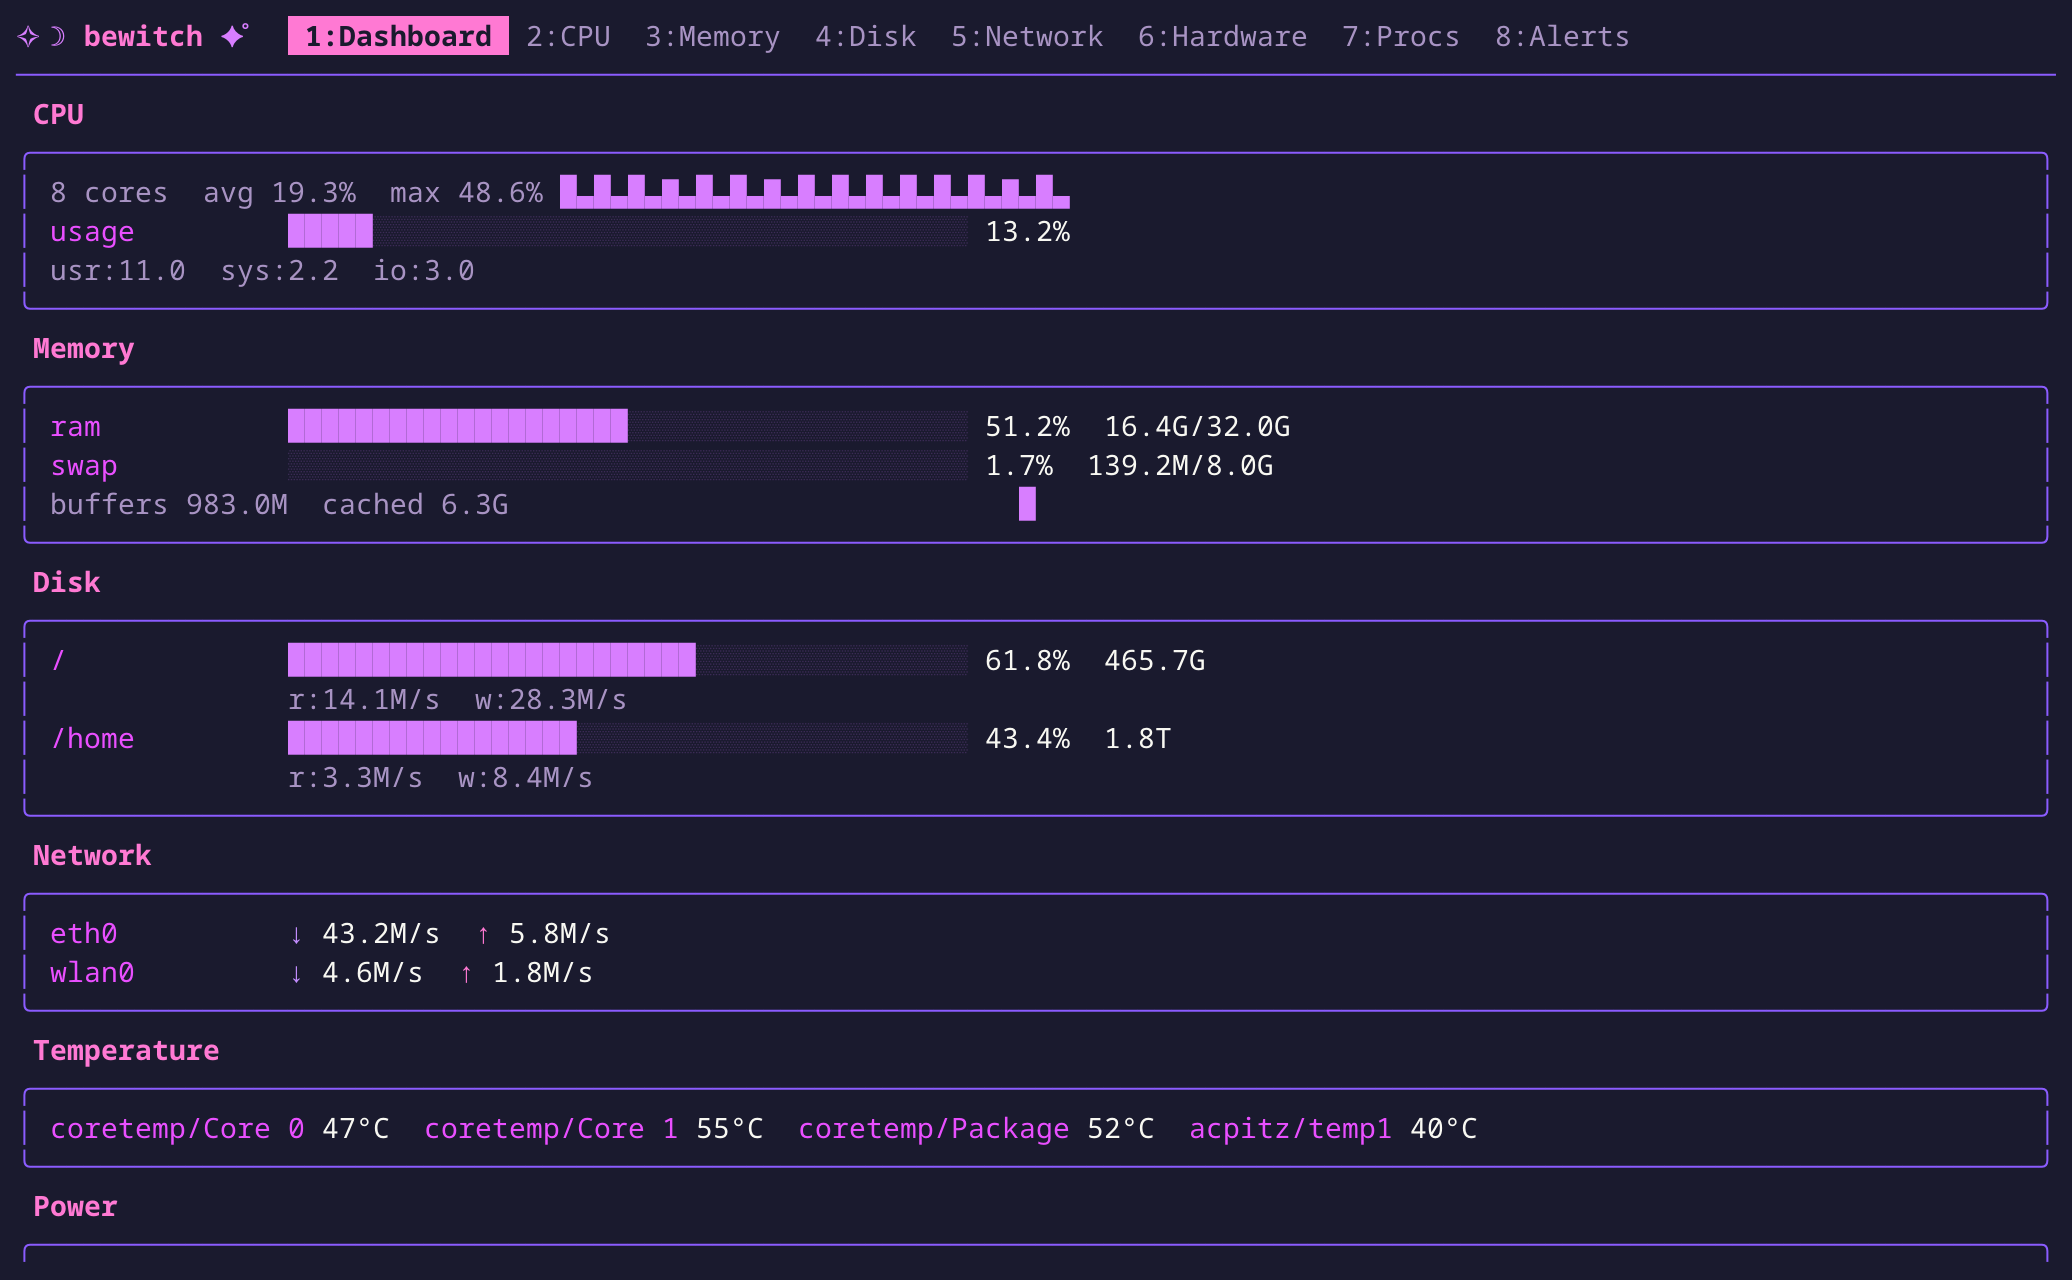
Real-time TUI dashboard with historical charts, hardware monitoring, interactive SQL REPL, and alerting.
install
$ curl -sSL https://bewitch.dev/install.sh | shA charming system monitor for Linux
Real-time TUI dashboard with historical charts, hardware monitoring, interactive SQL REPL, and alerting.
$ curl -sSL https://bewitch.dev/install.sh | shFrom Raspberry Pis to cobbled-together racks, hobbyists and developers run a diverse collection of servers for fun and sometimes profit.
bewitch is designed for people who want monitoring without the overhead of enterprise tools or cloud services.
Whether you're tracking a home media server, a personal website, or a cluster of machines in your basement, bewitch is a fun way to keep an eye on your hardware.
Per-core usage tracking with aggregate metrics, historical charts, and automatic delta computation.
Real-time memory usage, available/free breakdown, ECC error tracking for server reliability.
Space usage, I/O rates, and SMART health per physical device. NVMe and SATA supported.
Per-interface RX/TX throughput with bits/bytes toggle and historical bandwidth charts.
Temperature sensors, GPU monitoring (Intel and NVIDIA), power consumption (RAPL), and ECC memory errors in one unified view with sub-tab navigation.
All processes visible, top N enriched. Glob-pattern pinning for critical services. Sortable, searchable.
Threshold, predictive, and variance rules. Notify via email or shell command.
Query your metrics directly with SQL. Interactive REPL with tab completion, multi-line editing, dot-commands, and data export to CSV, Parquet, or JSON.
Route alerts via email (local mail command or SMTP) or arbitrary shell commands. All config-driven, no code required.
Connect to remote daemons over TLS with auto-generated certificates and SSH-like fingerprint pinning. No CA infrastructure needed.
1. Install
2. Launch the TUI